Cronbee Documentation
1. Introduction
1.1 Getting started with Cronbee
Cronbee is a simple yet powerful tool for monitoring jobs running on remote devices. It helps individuals and teams keep track of the status of tasks and processes that might otherwise be opaque.
You can integrate Cronbee into your shell scripts, crontabs, use our CLI package for Debian, or call the API from popular platforms: PHP, Java, Node.js.
1.2 Core Concept
A Cronbee monitor acts as an event listener and notification dispatcher. When you create a monitor, you configure it to expect periodic event signals. If a signal is not received or arrives outside configured limits, notifications are sent to alert team members of potential issues. For more information, see the F.A.Q..
1.3 Simple Ping vs Workflow Monitoring
Cronbee supports two modes of operation, suitable for various use cases.
1.3.1 Simple Mode
In its simplest form, a Cronbee monitor acts as a 'ping' listener, a kind of watchdog. This involves sending an event each time a task starts or finishes. Cronbee will display the event in your dashboard or generate a notification if it doesn't occur.
1.3.2 Advanced Mode
In advanced mode, Cronbee captures an arbitrary number of events via its API, which can be displayed on your dashboard. This allows for granular monitoring of complex, multi-stage tasks, helping identify problematic or long-running stages.
1.4 Installation
Cronbee is a SaaS platform, so no software installation is required unless you use the Cronbee CLI. Essential requirements include:
- An account on cronbee.com
- A method to send HTTP requests to the Cronbee API (typically from a server or remote device)
1.5 Quick Start
Each monitor is identified by a unique ID. You can copy the ID by hovering over the monitor name and clicking the ![]() copy icon in the UI.
copy icon in the UI.
1.5.1 Cronbee API
The Cronbee API is available at https://api.cronbee.com, and all monitor-related operations should be sent to https://api.cronbee.com/monitor/.
1.5.2 Make a Request
Using curl, you can ping your monitor (replace the ID with your monitor ID):
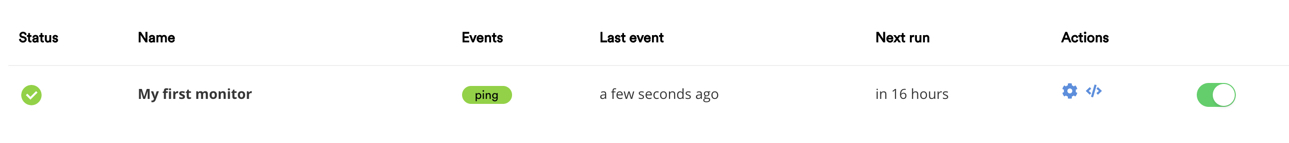
# Ping a monitor
curl -fsS --retry 3 https://api.cronbee.com/monitor/your-monitor-id/ping
You should see your monitor update in the UI:
2. Setup Guide
Setting up a Cronbee monitor is quick. We'll use CURL in our examples to make calls to the Cronbee API. You'll need to configure your monitor on the cronbee.com web app.
2.1 Configure a Monitor
- Sign up for an account at cronbee.com.
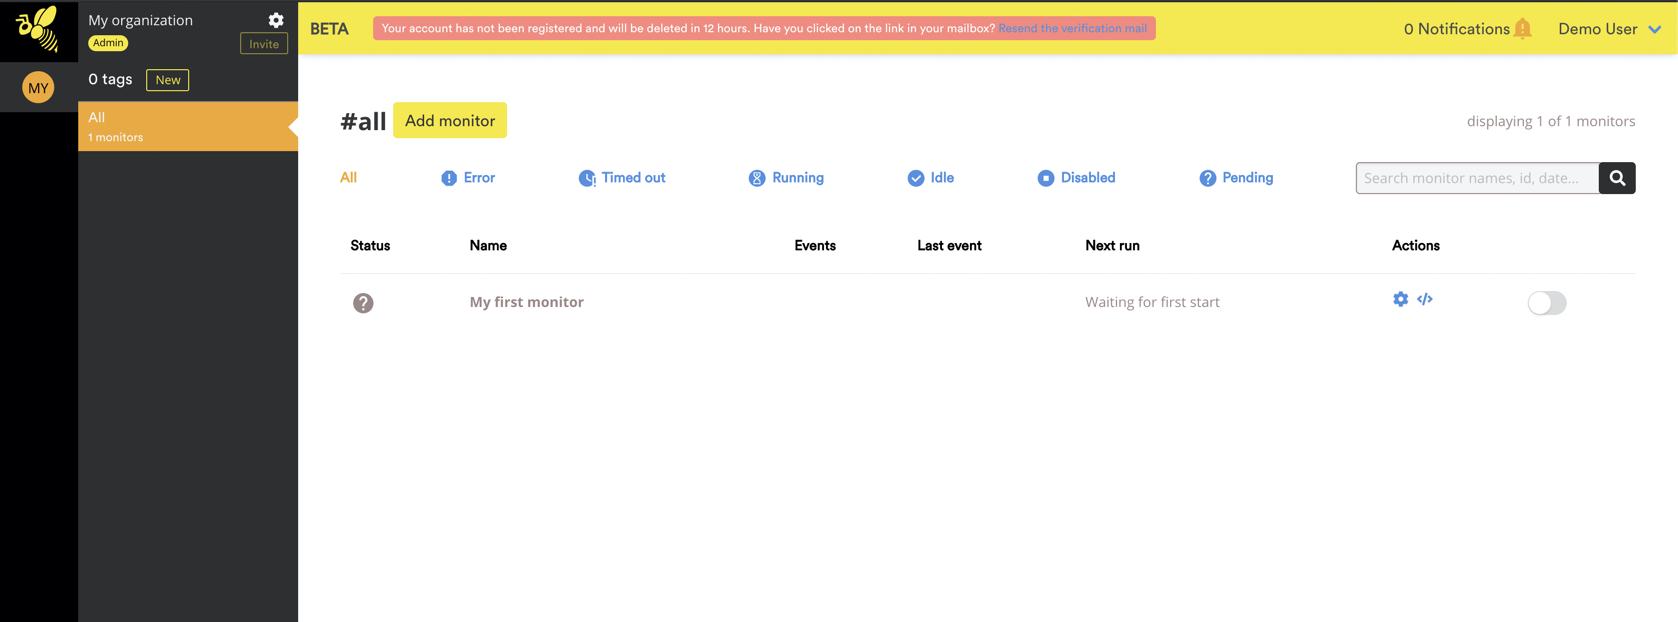
- After signing up and activating your account, you'll see the web app for the first time. A monitor is already created but turned off.
- Click the cog icon to open the monitor's settings.
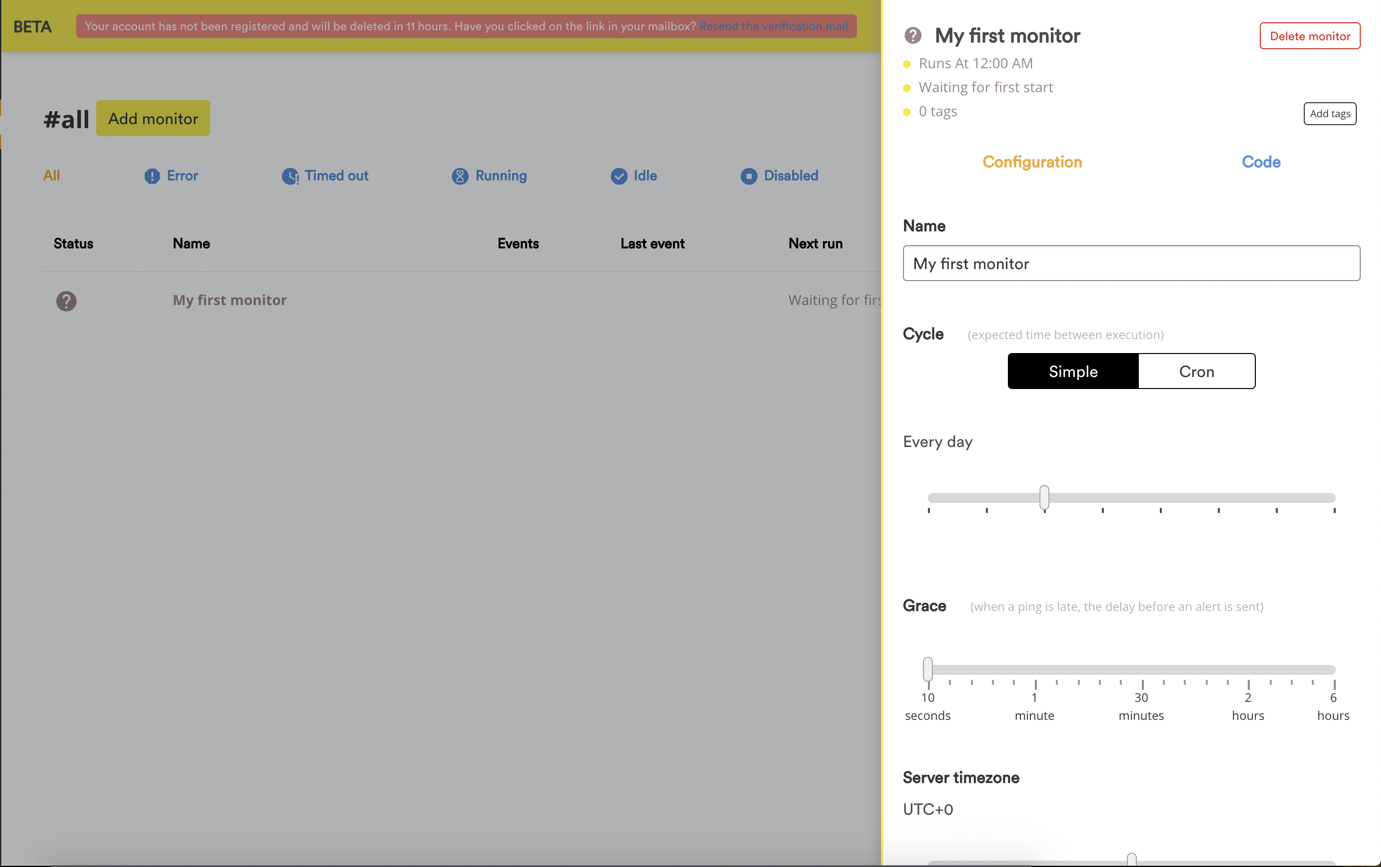
- Edit various settings on your monitor. See monitor settings for details:
Enable your monitor at this point.
2.1.1 Monitor Settings Explained
2.1.1.1 Monitor Tags and Name
These are for organizational purposes and do not affect monitor performance. You can filter monitors by tags in the left panel.
2.1.1.2 Expected Execution Cycle
Configure your monitor to match your server job's execution frequency. Cronbee offers preconfigured or custom cronstring options.
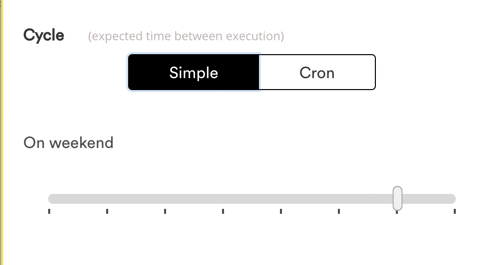
2.1.1.2.1 Preconfigured Cycles
The simple cycle selector offers pre-configured time increments, from every minute to once a week.
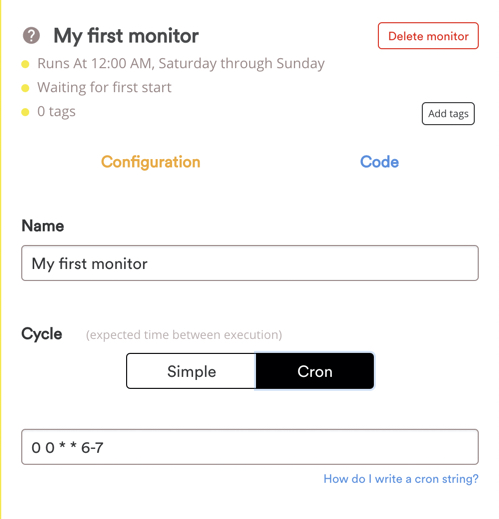
2.1.1.2.2 Custom Cron Strings
For tasks that don't fit standard intervals, specify custom cron strings. Access these settings by selecting the 'cron' button in the selector menu:
As you write your cronstring, Cronbee displays the resulting schedule at the top of the monitor pane for validation:
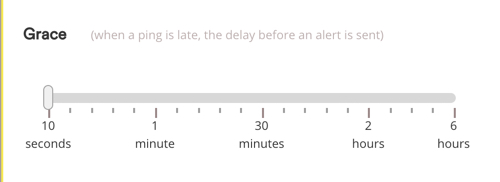
2.1.1.3 Execution Grace Period
Configure a grace period during which no alerts are generated, even if a task fails to send a ping or start event signal. This is useful for long-running jobs.
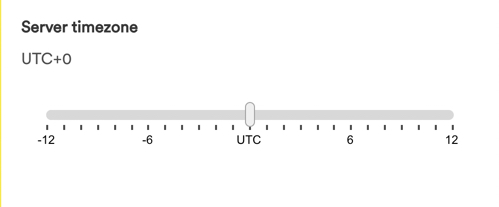
2.1.1.4 Server Timezone Settings
Most servers use UTC by default. If your server uses a localized timezone, configure it here to ensure Cronbee monitors function correctly.
2.2 Basic Monitor Use
Integrate Cronbee into your tasks using a shell script. Have your unique monitor ID ready. Use Cronbee to indicate a job start with CURL:
# This command sends a ping to your monitor to indicate a task has started.
# Ensure you have your monitor ID ready and replace 'your-monitor-id' with it.
curl -fsS --retry 3 https://api.cronbee.com/monitor/your-monitor-id/ping && [your job command or script]
You should see your monitor update in the UI:
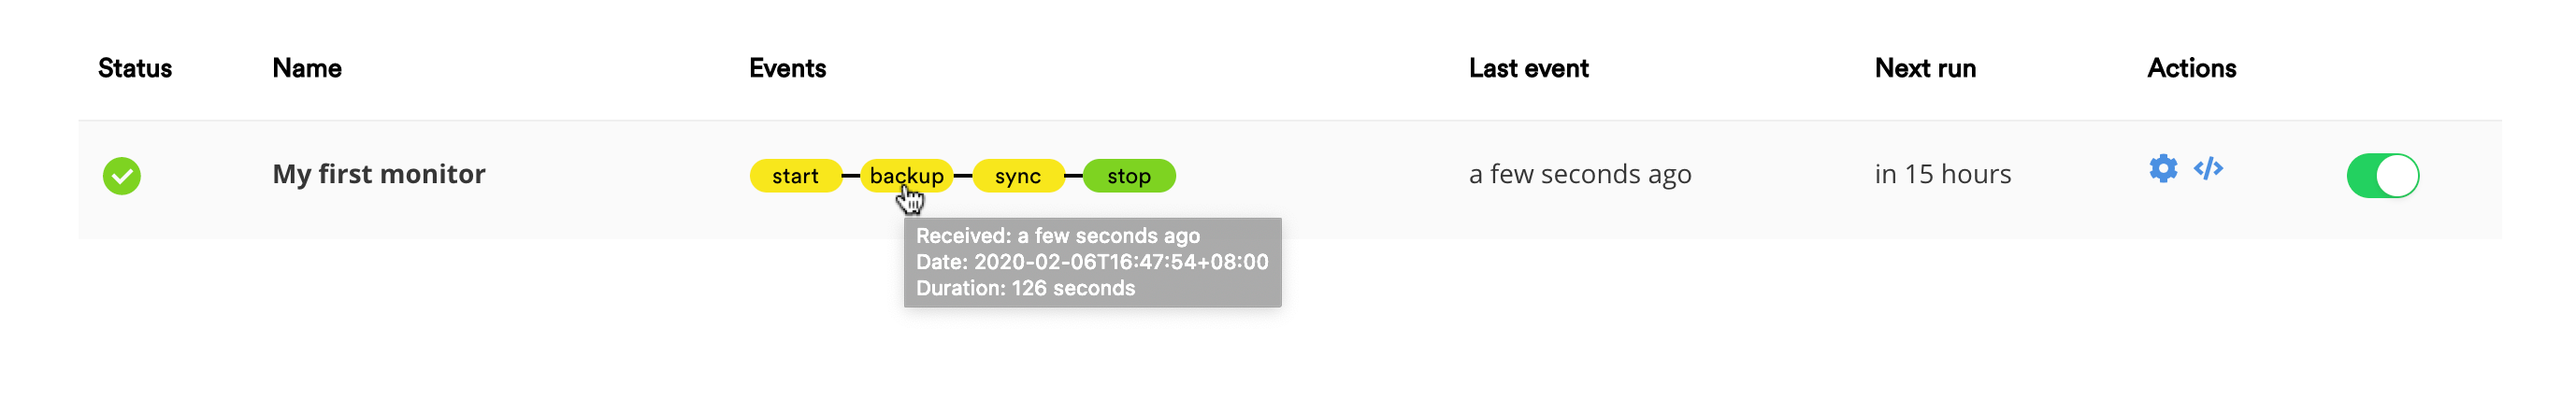
2.3 Advanced Event Monitoring
For multi-stage workflows, monitor each part, such as a database backup followed by a cloud sync. Cronbee excels in building dynamic workflows and notifying your team of issues.
- Use a single task-instance identifier token. A call to a Cronbee monitor API endpoint without the
/pingpath starts workflow tracking (astartevent) and returns a token. - Further API calls should append the
/event/[eventname]path and parameter, indicating the event stage.
Example:
# Get a token and start the workflow
TOKEN=`curl -fsS --retry 3 "https://api.cronbee.com/monitor/your-monitor-id"`

# --- script boot ---
curl -fsS --retry 3 "https://api.cronbee.com/monitor/your-monitor-id/event/backup?token=$TOKEN"

# --- backup script ---
curl -fsS --retry 3 "https://api.cronbee.com/monitor/your-monitor-id/event/sync?token=$TOKEN"

# --- sync script ---
curl -fsS --retry 3 "https://api.cronbee.com/monitor/your-monitor-id/event/stop?token=$TOKEN"
View your monitoring pipeline results in the Cronbee web app:
3. Examples
3.1 Shell Script
To use Cronbee in a shell script, you can ping your monitor at the start and end of your script to track its execution:
# Start the job
curl -fsS --retry 3 https://api.cronbee.com/monitor/your-monitor-id/ping/start

# Your script logic here
echo "Running some tasks..."

# End the job
curl -fsS --retry 3 https://api.cronbee.com/monitor/your-monitor-id/ping/end
3.2 Crontab
Integrate Cronbee with crontab by adding a ping command to your scheduled tasks:
# Example crontab entry
* * * * * curl -fsS --retry 3 https://api.cronbee.com/monitor/your-monitor-id/ping && /path/to/your/script.sh
3.3 PHP
Use the Cronbee API in a PHP application to send a ping:
<?php
$monitorId = 'your-monitor-id';
$ch = curl_init("https://api.cronbee.com/monitor/$monitorId/ping");
curl_setopt($ch, CURLOPT_RETURNTRANSFER, true);
$response = curl_exec($ch);
curl_close($ch);

echo "Ping sent: " . $response;
?>
3.4 Node.js
Demonstrate using Cronbee with Node.js for event monitoring:
const https = require('https');

const monitorId = 'your-monitor-id';
const url = `https://api.cronbee.com/monitor/${monitorId}/ping`;

https.get(url, (res) => {
  console.log(`Status Code: ${res.statusCode}`);
}).on('error', (e) => {
  console.error(`Error: ${e.message}`);
});
3.5 Java
Illustrate how to integrate Cronbee into a Java application:
import java.net.HttpURLConnection;
import java.net.URL;

public class CronbeeExample {
    public static void main(String[] args) {
        try {
            String monitorId = "your-monitor-id";
            URL url = new URL("https://api.cronbee.com/monitor/" + monitorId + "/ping");
            HttpURLConnection connection = (HttpURLConnection) url.openConnection();
            connection.setRequestMethod("GET");

            int responseCode = connection.getResponseCode();
            System.out.println("Response Code: " + responseCode);
        } catch (Exception e) {
            e.printStackTrace();
        }
    }
}
3.6 Execution Logs & Artifacts (Business)
This example shows a complete workflow using execution tokens, logs, and artifacts. Logs and artifacts storage are Business plan features.
3.6.1 Start an execution and capture the token
# Start the execution and capture the JSON response
RESPONSE=$(curl -fsS --retry 3 "https://api.cronbee.com/monitor/your-monitor-id")

# Extract the token (requires 'jq'; otherwise parse manually)
TOKEN=$(echo "$RESPONSE" | jq -r '.token')

echo "Execution token: $TOKEN"
3.6.2 Append structured log lines
Use the /log endpoint when you can easily build JSON (CLI, SDK, application code).
curl -X POST "https://api.cronbee.com/monitor/your-monitor-id/log" \
  -H "Content-Type: application/json" \
  -d "{
    \"token\": \"$TOKEN\",
    \"lines\": [
      { \"ts\": 1706012345678, \"t\": \"o\", \"c\": \"Starting backup...\" },
      { \"ts\": 1706012345890, \"t\": \"e\", \"c\": \"Warning: Connection timeout\" }
    ]
  }"
3.6.3 Append raw log text (Business)
Use the /log/raw endpoint for simple scripts or when you already have a log file.
The request body is text/plain, and the token is passed as a query parameter.
# Send a single multi-line log block
curl -X POST "https://api.cronbee.com/monitor/your-monitor-id/log/raw?token=$TOKEN" \
  -H "Content-Type: text/plain" \
  --data-binary $'Starting job\nProcessing...\nJob finished successfully\n'

# Or stream an existing log file
curl -X POST "https://api.cronbee.com/monitor/your-monitor-id/log/raw?token=$TOKEN" \
  -H "Content-Type: text/plain" \
  --data-binary @/var/log/my-task.log
Each non-empty line is stored as a separate stdout line with the server reception time as timestamp.
3.6.4 Upload an artifact (Business)
Upload a result file (backup, report, archive, etc.) linked to the same execution token.
curl -X POST "https://api.cronbee.com/monitor/your-monitor-id/artifact" \
  -F "token=$TOKEN" \
  -F "file=@/path/to/backup.sql.gz"
Uploaded artifacts will appear in the execution details panel in the Cronbee UI (Business plan only).
4. API Reference
-
Base URL:
https://api.cronbee.com -
Endpoints:
-
Ping Monitor:
/monitor/{monitor-id}/ping- Method: GET
- Description: Sends a ping to the specified monitor.
- Parameters:
monitor-id(string): The unique identifier for the monitor.
- Response:
200 OK: Ping successful.4xx/5xx: Error codes indicating issues.
-
Event Monitor:
/monitor/{monitor-id}/event/{eventname}- Method: GET
- Description: Sends an event to the specified monitor, useful for tracking multi-stage workflows.
- Parameters:
monitor-id(string): The unique identifier for the monitor.eventname(string): The name of the event being sent, representing a specific stage in the workflow.token(string, optional): A token for tracking the workflow instance. This token is obtained from the initial call to start the workflow.
- Response:
200 OK: Event successfully recorded.4xx/5xx: Error codes indicating issues.
-
Append Log Lines:
/monitor/{monitor-id}/log- Method: POST
- Description: Appends structured log lines (with timestamps, type, and content) to an execution using an execution token.
- Body (
application/json):token(string, required): Execution token UUID.lines(array, required): List of log line objects:ts(integer): Timestamp in Unix milliseconds.t(string): Type (o= stdout,e= stderr).c(string): Log line content.
- Response:
200 OK: Log lines appended, returns total log size for this execution.4xx/5xx: Error codes indicating issues (e.g., log size limit exceeded).
-
Append Raw Log [Business]:
/monitor/{monitor-id}/log/raw- Method: POST
- Plan: Business only
- Description: Appends raw log content (plain text body) to an execution using an execution token in the query string.
- Query parameters:
token(string, required): Execution token UUID.
- Body (
text/plain):- Raw log text. Each non-empty line is stored as a separate stdout line with the server reception time as timestamp.
- Response:
200 OK: Log lines appended, returns total log size for this execution.4xx/5xx: Error codes indicating issues (e.g., log size limit exceeded).
-
Upload Artifact [Business]:
/monitor/{monitor-id}/artifact- Method: POST
- Plan: Business only
- Description: Uploads a file artifact for an execution using an execution token.
- Body (
multipart/form-data):token(string, required): Execution token UUID.file(file, required): Artifact file to upload.
- Response:
200 OK: Artifact uploaded, returns artifact identifier and metadata.4xx/5xx: Error codes indicating issues (e.g., artifacts not allowed on current plan, size limit exceeded).
-
4.1 Workflow Example
-
Start the Workflow: Initiate the workflow by sending a request to the monitor without the
/pingor/eventpath. This will start the workflow and return atokenthat you will use for subsequent event calls.TOKEN=`curl -fsS --retry 3 "https://api.cronbee.com/monitor/your-monitor-id"` -
Send Events: For each stage of your workflow, send an event using the
/event/{eventname}path. Include thetokenobtained from the start of the workflow.# Example for a backup stage curl -fsS --retry 3 "https://api.cronbee.com/monitor/your-monitor-id/event/backup?token=$TOKEN" # Example for a sync stage curl -fsS --retry 3 "https://api.cronbee.com/monitor/your-monitor-id/event/sync?token=$TOKEN" -
End the Workflow: Optionally, you can send a final event to indicate the end of the workflow.
curl -fsS --retry 3 "https://api.cronbee.com/monitor/your-monitor-id/event/stop?token=$TOKEN"
4.2 Notes
- Token Usage: The
tokenis crucial for associating all events with the same workflow instance. Ensure it is included in every event call. - Event Names: Choose meaningful event names that represent the stages of your workflow for better tracking and analysis.
- Error Handling: Monitor the response codes to handle any errors that may occur during the API calls.
5. Troubleshooting
- Issue: Monitor not receiving pings.
- Solution: Check network connectivity and ensure the correct monitor ID is used.
- Issue: API returns a 4xx error.
- Solution: Verify the API endpoint and parameters. Ensure your account is active.
6. Glossary
- Monitor: A tool that tracks the status of tasks and sends notifications if issues arise.
- Event: A signal or occurrence that a monitor listens for.
- Ping: A signal sent to a monitor to indicate the start or end of a task.
7. Feedback
We value your feedback! If you have suggestions or encounter issues with this documentation, please contact us at [email protected].
